Insert an infographic
Video not loading? Try it on 
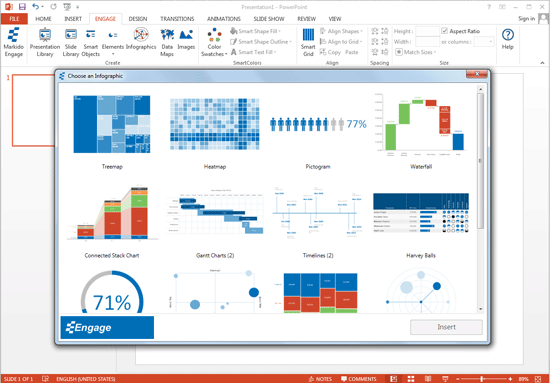
- From the Engage tab, click on the Infographics button. Select an infographic and click the Insert button.
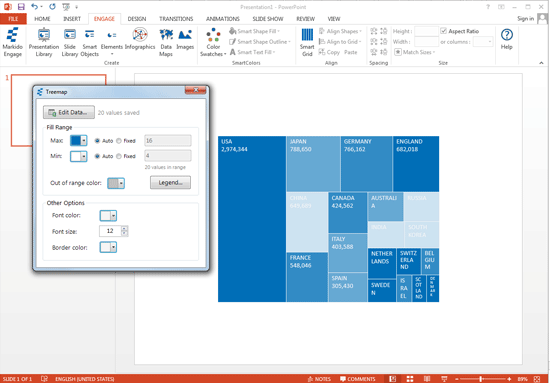
- The infographic will appear along with a dialog box to help you customize it with your own data and preferences.
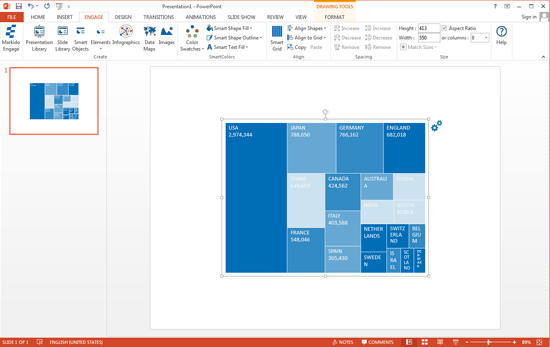
- You can reopen the infographic dialog box by clicking on the infographic to reveal 2 gears on the top right of the infographic, click on those gears to open the dialog box.
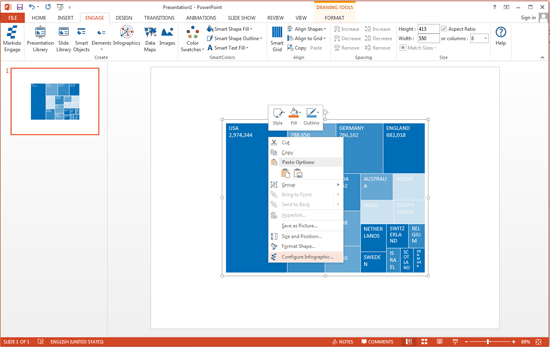
- You can also right click on the infographic and select Configure Infographic.
- You can also modify infographics like you would any PowerPoint object (e.g. change color, resize, etc.) manually.
Still can't find your answer? Email us