Create a Treemap in Engage

What is a Treemap Chart?
A treemap organizes two dimensions of data into rectangles and colors. The rectangle size and color is based on the value (i.e. bigger value means bigger rectangle, darker color).
Example
Sometimes you want to show how two different variables appear in the same chart. This example is for a portfolio of projects where I want to show project budget (variable 1) and profit margin (variable 2).
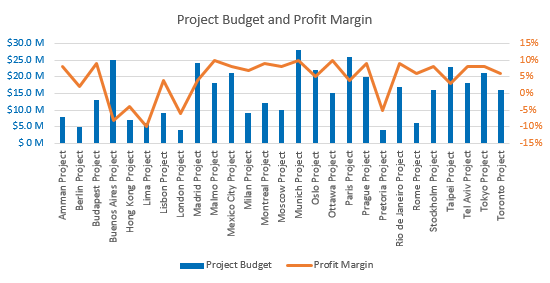
I created a bar chart with a secondary axis to plot the profit margin data. All the information that I want to show is there but when you look at it, try to spot the takeaway message. (Good luck, it really isn't obvious.)
You'll notice that with a bar chart, each project is accorded the same amount of prominence in the chart. I want to include all the projects but I also want my audience to focus on the bigger budget projects more than the smaller revenue ones. The other issue with the chart is that it's difficult to make sense of the relationship (if any) between the two variables (the project budget and its profit margin).
Adding a Treemap Chart
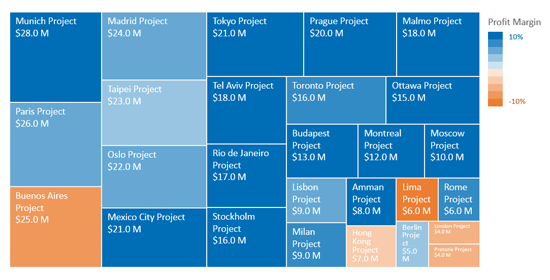
With the treemap chart, people can more clearly see the relationship between our two variables. The size of the rectangle represents the project budget; the bigger the rectangle, the bigger the budget. The color of the rectangle represents the profit margin; the darker the square the higher the positive or negative profit margin.
With the treemap, people can quickly make sense of the data and identify different clusters of data. For example, only 5 projects are operating with a negative profit margin. Except for the Buenos Aires project, the majority of projects with a negative profit margin have a small budget.
The other advantage treemaps have is that you can legibly display many more items than with other types of charts. What makes this possible is that each item is proportional to its importance. For example, projects with greater budgets are more important and will have bigger squares based on the data of that variable.