Create a Pictogram Chart in Engage
Video not loading? Try it on 
What is a Pictogram Chart?
A pictogram chart uses icons to present numbers. This gives viewers context about the subject the numbers represent. For example a statistic relating to people might be expressed using people icons with a color fill applied to the icons that corresponds with the statistic.
Example
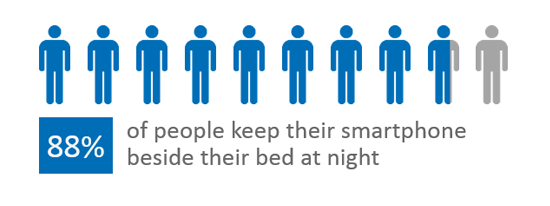
Here's an example of a statistic:
- 88% of people keep their smartphone beside their bed at night
Adding a Pictogram Chart
Using the same data as in the example below we can add a pictogram chart to help capture the attention of viewers and give meaning to the related information being presented.
Still can't find your answer? Email us