Create a Gantt Chart in Engage

What is a Gantt Chart?
A Gantt chart is a series of horizontal bars that show the start and end dates for different activities. The horizontal axis represents the given time span of the project (i.e. days, weeks or months.)
Gantt charts allow users to quickly see what the required activities are, the start and end dates for each activity, and the order in which the activities are to be completed.
Example
The following are activities that need to be completed in order to successfully finish this project.
| Activity | Planned Start | Planned Duration | Actual Start | Actual Duration |
|---|---|---|---|---|
| Planning | 1 | 2.5 | 1 | 2.8 |
| Procurement | 1.5 | 3 | 1.25 | 4 |
| Implementation | 4 | 6 | 5 | 7 |
| Testing | 8.5 | 3 | 11 | 3 |
| Deployment | 11.5 | 1.25 | ||
| Measurement | 12 | 3 |
The table above shows when each activity is planned to start and the planned duration. Actual start and duration values have been entered for activities that have been completed. We can visualize this data using a Gantt chart.
Adding a Gantt Chart
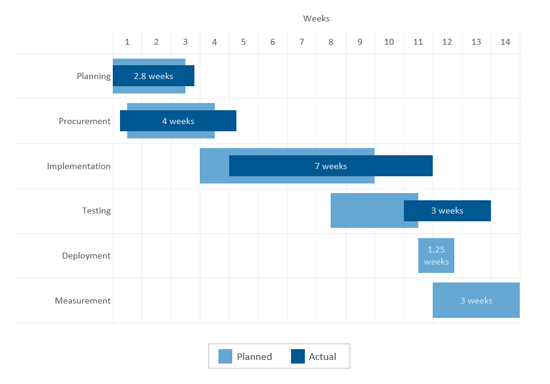
In the Gantt chart above, we can easily see how the actual values compare to the planned values for each activity. For example, we see that for the Planning activity, the work began on time but took a bit longer than expected. We can also see which activities overlap and can be done concurrently and which activities depend on other activities being completed before they can begin. The Testing activity must be completed before the Deployment activity may begin.