Create a Timeline Chart in Engage
Video not loading? Try it on 
What is a Timeline Chart?
A timeline chart shows different events in chronological order. Showing events such as project milestones across a timeline chart makes it easier for your audience to visualize how the timing of those events relate to one other.
Example
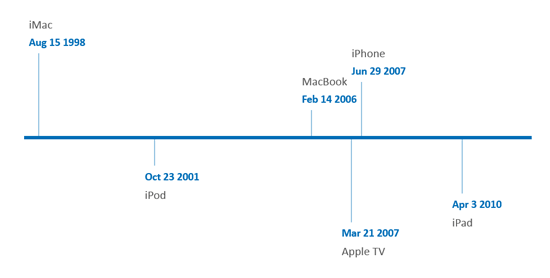
The following are the launched dates for major Apple Inc. products introduced during the period in which Steve Jobs returned to the company in 1996 until his death in 2011.
| Date | Product |
|---|---|
| Aug 15 1998 | iMac |
| Oct 23 2001 | iPod |
| Feb 14 2006 | MacBook Pro |
| Mar 21 2007 | Apple TV |
| Jun 29 2007 | iPhone |
| Apr 3 2010 | iPad |
Adding a Timeline Chart
The timeline chart makes it easier to see the sequence and timing of events.
Still can't find your answer? Email us