Create a Marimekko Chart in Engage

What is a Marimekko Chart?
A marimekko chart is a combination of the 100% stacked column chart and the 100% stacked bar chart. Users can add additional dimensions of data to a stacked chart like in the one shown below.
Example
This 100% stacked column chart shows the number of passenger cars sold in multiple regions for 2014.
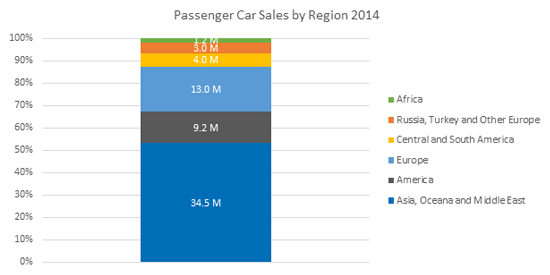
In addition to the information provided above, I will show the top countries where the most passenger cars were sold across all regions.
Adding a Marimekko Chart
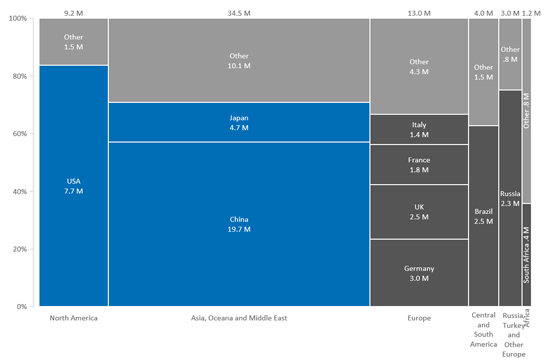
In this example, each column represents a region. In addition to showing the quantity of cars sold through varying heights (as in a regular 100% stacked column chart), the marimekko chart varies the width of each column (as in a regular 100% stacked bar chart) to account for the varying quantities of cars sold across the multiple regions.
Based on the size of each block, it's clear that China is the biggest passenger car market followed by the USA and Japan. Noticed that the top 3 countries are color-coded blue while the rest of the top 10 markets are color-coded gray and the remaining other markets are color-coded in light gray. This is the focus the attention of the audience to the top 3 markets of importance. A good heading for this marimekko chart could be: "China, USA, and Japan account for almost 50% of all passenger cars sold worldwide."
You can modify the color of any block in the marimekko chart in order to focus the attention of your audience on the message you're trying to convey. Here is another example of a marimekko chart where color is used to focus the attention of the audience across multiple the different type of product offerings for the top 3 selling automotive brands in the USA.
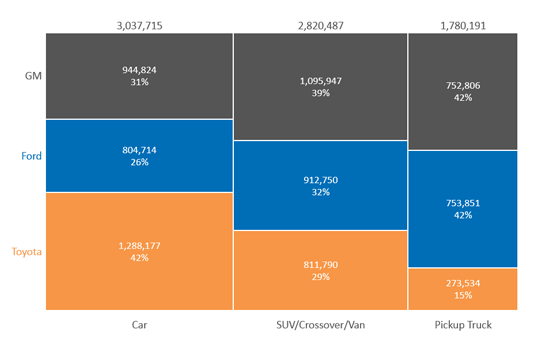
In this marimekko chart, we see that the car segment is the most popular type of vehicles sold in the USA (3,037,715 units sold for 2014) follow by the SUV/Crossover/Van segment and then the pickup truck segment. Each automotive brand is color-coded to make it easy to follow their unit sold and market share across the multiple segments. We see that Toyota significantly outsells GM and Ford in the car segment and that all three are about even in the SUV/Crossover/Van segment while GM and Ford sell far more pickup trucks than Toyota.