Create a Funnel Chart in Engage

What is a Funnel Chart?
A funnel chart is a graphic used to represent stages in a process and to show the progressive data reduction from one stage to another.
Example
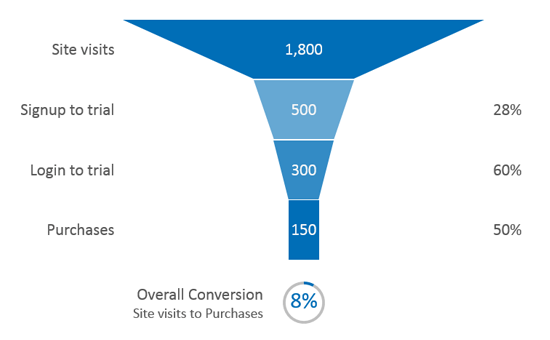
Imagine a marketing analyst trying to show the management team where their efforts should be focused on improving sales on their website. The marketing analyst has the following user data that represent how many people visit the website and the progressive reduction in numbers as only a subset of those visitors signup to the trial, then login to the trial and finally the subset that decide to purchase the product.
| Action | Value | Conversion Rate |
|---|---|---|
| Site visits | 1,800 | |
| Signup to trial | 500 | 28% |
| Login to trial | 300 | 60% |
| Purchases | 150 | 50% |
Adding a Funnel Chart
Adding a funnel chart like the one below can help viewers better see at what stage the major conversion reduction are happening. In the funnel chart below we can see that the greatest conversion reduction is happening at the site visits to signup to trial stage at 28%. If we focus our efforts on improving this stage, we can see the impact this would have on the rest of the funnel including on the overall site visits to purchases conversion rate.