
NPV (Net Present Value)
NPV Intro
The NPV function is great when comparing different investment projects that have different cash flows.
If all investment projects you were comparing had the exact same net cash flows except for one year, maybe you wouldn't need to calculate the NPV because picking the best option would be obvious like in the example below.
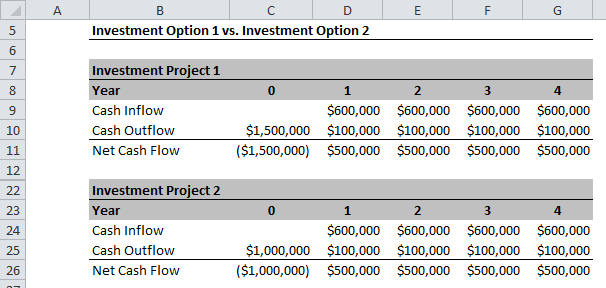
Investment Project 1 and 2 have the exact same net cash flows starting in Year 1 up until Year 4 of $500,000 each year. The only difference is the initial cash investment of $1,500,000 in option 1 and $1,000,000 in option 2. If you picked option 2 as being the better option, you are correct since option 2 requires less investment for the same cash flows from Year 1 to Year 4.
Notice I labeled the current year as Year 0. I'll explain why that's a good idea a bit further down.
So you've selected Investment Project 2 but your boss gets cold feet and suggests a new option, let's call it option 2b. Instead of investing $1,000,000 now and getting $500,000 back each year for 4 years, you would invest $500,000 this year, another $500,000 next year and then get $500,000 back each year for 4 years. Which is the better option?
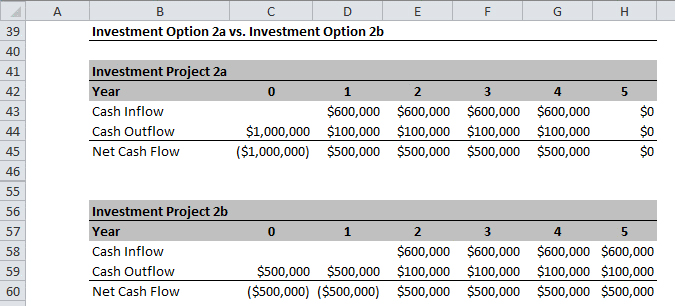
If you ignore the time value of money, then both option 2a and 2b are the same, your invest $1,000,000 and eventually you get back $2,000,000.
If you already familiar with the concept of Present Value, then you know option 2a and 2b are not the same. Basically a dollar today is worth more than a dollar a year from now. (If the concept of Present Value is a bit hazy or if you've never heard of it, check out the Present Value post before going any further.)
So which option is better, option 2a or 2b? That's what the NPV is for. The NPV discounts each cash flow back to its Present Value and then adds them up. It makes for comparing different projects with different cash flows at different times possible.
NPV Using Formula
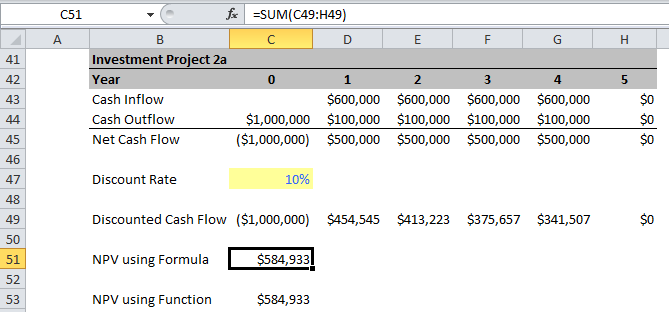
- Step 1: Calculate the Net Cash Flow (Cash Inflow minus Cash Outflow).
- Step 2: Discount each Net Cash Flow back to its present value.
- Step 3: Add up each discounted net cash flow.

Notice when discounting each cash flow to the present value you divide by (1+10%) once for Year 1, twice for Year 2, thrice for Year 3, etc. The exponents in the denominator match the year labels. This is why it's a good idea of label the current year as year 0 because you don't discount the current year, it's already at Present Value.
The sum of these discounted net cash flows is equal to $584,933.
NPV Using Function in Excel
Using the NPV function in Excel, we should arrive at the same NPV result as above.
Take the net cash flow in Year 0 and then add the NPV function. The reason you need to add the first current net cash flow and not include it in the NPV function is that Excel would discount it and it's already at Present Value so you don't need to discount it.
This is what the function should look like in your formula bar:
= C44 + NPV(C46,D44:H44)
This is what it looks like in plain English:
Net Cash Flow in Year 0 + NPV(Discount Rate, Range of Net Cash Flows you want to discount)

= -$1,000,000 + NPV(10%, $500,000, $500,000, $500,000, $500,000, $0)
The result using the NPV function is $584,933 and matches the result using the NPV formula.
So now you know how to calculate the NPV to multiple investment projects, which is option is better? Option 2a or 2b?
To see the answer and all supporting formulas, you can download the source Excel file below.
Supporting Files
Markido Assets - NPV.xls
Related Posts
Present Value